Inside this article
Introduction
Many traders look at the win rate as if it were the ultimate test of the quality of a strategy.
If they win often, they think they are on the right track. If they lose more trades than they win, they immediately think the method doesn't work. The problem is that this reading is incomplete.
The win rate in trading indicates how many trades you close in profit with respect to the total trades made.It is a useful metric, but on its own it is not enough to understand if a strategy is really sustainable.
A trader can have a high win rate and lose money. It can have a low win rate and win, if the winning trades are much bigger than the losing ones. For this reason, the win rate must always be read together with the risk, average return, profit factor and quality of execution.
The point is not to win so many trades. Thepoint is to understand if the way you win and lose produces a healthy result over time.
If you really want to evaluate a strategy, the win rate must be part of a broader reading of the trading performance analysis , not an isolated number.
The real issue
The problem arises when the trader confuses the frequency of winnings with the quality of the system.
Winning often makes senseone immediate control. After some positive trades, the trader feels more confident, increases the lot, reduces the focus on the stop loss and starts to think that the strategy is solid just because he "takes so many times".
But the market does not reward those who are right most often. Reward those who manage the relationship between how much they lose when they are wrong and how much they gain when they are right.
The win rate answers a specific question:"How many trades have been closed in profit compared to the total?"
Instead, it does not answer other fundamental questions:
- How much do I earn on average when I win?
- How much do I lose on average when I'm wrong?
- Is the risk per trade consistent?
- Are the losses controlled or too large?
- Do winning trades really cover losing trades?
- Does the strategy hold up even in the negative phases?
Without this information, the win rayou can become a deceptive metric. It shows you a part of the picture, but it doesn't tell you if the bill is growing in a healthy way.
What is win rate and how is it calculated
The win rate is the percentage of winning trades with respect to the total number of trades executed.
The formula is simple:
Win rate = number of winning trades/total number of trades x 100
Example:
• total trades: 10
• winning trades: 6
•losing trades: 4
Formula:
6 / 10 x 100 = 60%
In this case the trader has a win rate of 60%.
This means that out of 10 trades, 6 were closed in profit. The fact is clear, but it is still not enough to judge the strategy.
Why?
Because we don't know how much he gained in the 6 winning trades and how much he lost in the 4 negative trades.
Two traders can have the same 60% win rate, but completely different results.
Trader A:
• 6 wins of 100 euros;
• 4 losses of 50 euros;
• final result: +400 euros.
Trader B:
• 6 wins of 30 euros;
• 4 losses of 100 euros;
• final result: -220 euros.
The win rate is identical, but the result is the opposite.
This is the first point to understand: the win rate measures the frequency of the winnings, not the economic quality of the winnings.
/Why/The win rate is often misinterpreted because it touches a very strong emotional part of trading: the need to be right.
For many traders losing a trade weighs more than necessary. It is not seen as a normal cost of the method, but as a personal mistake. As a result, they seek strategies with very high win rates because they want to avoid the psychological feeling of loss.
This leads to several problems.
The first is tagmess up the profits too early. The trader sees a small gain, is afraid that the market will go back and close immediately. This increases the number of winning trades, but reduces the average profit.
The second is to let the losses run. When the price goes against the position, the trader does not accept the stop, moves the exit level, waits for a recovery and turns a normal loss into a much bigger loss.
The third ischoose setup with small targets and large stops just to be more likely to close positive. This can raise the win rate, but worsen the risk/reward ratio.
The fourth is to judge strategy on a few trades. After 5 or 10 positive trades, the trader thinks he has a strong method. But a sample that's too small doesn't say enough. It can only be a favorable phase.
This is why the win rate should always be read insidea process, not as a number to look at alone.
Common Mistakes
The most common errors on the win rate almost always arise from a superficial reading of performance.
- Thinking that a high win rate automatically means a profitable strategy.
A win rate of 70% may sound great, but if the losses are much larger than the average profits, the account can still go down.
- Ignore the reportRATIOIf you risk 100 euros to earn 30, you have to win a lot of trades just to stay in balance. A small negative series is enough to erase many small profits.
- Evaluate the strategy only by the number of winning trades.
The trader looks at how many times he was right, but does not look at how much it cost him to be wrong.
- Increase the batch after a positive series.
A high win rate in a favorable phase can create excess dconfidence. The trader thinks he has found certainty, increases the risk and exposes himself too much.
- Don't distinguish between good trades and lucky trades.
A trade can close in profit even if it has been mishandled. If the trader only looks at the end result, he does not see the process errors.
- Do not record data accurately.
Without a trading journal, the trader often only remembers the most emotional trades. This makesimpossible to really read the win rate, average risk, average return and recurring errors.
- Compare different strategies using only the win rate.
A scalping strategy can have a high win rate and small targets. A trend following strategy may have lower win rates but larger average profits. Comparing them only on the percentage of winnings is a mistake.
What to do in practice
To use the win wellrates in trading, you need to stop reading it as a leaderboard and start reading it as part of a system.
The first thing to do is calculate it on a sufficient number of operations. Ten trades can help you understand an initial trend, but they are not enough to judge a strategy. The larger and more consistent the sample, the more useful the data becomes.
The second thing is to link the win rate to the risk/reward ratio.
Simple examplece• win rate: 50%
• average loss: 100 euros
• average profit: 200 euros
Even if the trader only wins once out of two, the strategy can be positive because the average wins are larger than the average losses.
Another example:
- win rate: 75%
- average loss: 200 euros
- average profit: 50 euros
In this case the trader often wins, but when he loses he suffers much heavier damage.
The third thing is to compare the win rate with theprofit factor. The profit factor in trading measures the ratio of gross profits to gross losses. It is very useful because it helps you understand if winning trades really make up for losing ones.
The fourth thing is to look at the risk per trade. A good win rate never justifies random risk management. If each transaction is opened with a different batch, without criteria, the data becomes dirty. The trading risk management serves precisely to make performance readable, because it allows you to compare operations performed with similar rules.
A practical reading can follow this sequence:
- Calculate the win rate.
- Calculate the average profit of winning trades.
- Calculates the average loss of negative transactions.
- Check the risk/reward ratio.
- Check if the batch has been consistent.
- Aanalyzes whether the operations complied with the plan.
- Separate valid trades from impulsive trades.
The win rate becomes useful only when it enters this full reading.
Concrete example
Imagine a trader making 10 trades on XAU/USD.
Result:
- 7 winning trades;
- 3 losing trades;
- win rate: 70%.
At first glance it looks like a good performance. The trader may think, “I won 7 out of 10 trades, so the strategia works”.But then look at the real numbers.
Winning trades:
• 7 operations from +30 euros;
• total profits: +210 euros.
Losing trades:
• 3 operations from -100 euros;
• total losses: -300 euros.
Final result:
+210 euros - 300 euros = -90 euros.
The trader has a win rate of 70%, but the account is at a loss.
The problem is not the percentage of winnings. The problem is that each loss weighs more than three wins. In practice, the trader has to do too muchpositive trades only to recover a single negative trade.
This scenario is very common.
It happens when the trader takes small profits for fear of losing them, but lets the losses run because he does not want to accept the stop. The result is a fragile account curve: lots of small wins, few big losses and a negative final performance.
A more correct behavior would have been to define before entry:
- quanto risking;
- where to put the stop;
- where to make a profit;
- which minimum risk/reward ratio to accept;
- when to avoid the trade if the potential does not justify the risk.
In this case, journaling would have immediately shown the problem: despite so many positive trades, the average return was too low compared to the average loss.
win rate and risk/reward ratio
Win rate doesn't worknever separated from the risk/reward ratio.
The risk/reward ratio indicates how much you are risking compared to how much you can get.
Example:
- risks 100 euros to look for 100 euros: 1:1 ratio;
- risks 100 euros to look for 200 euros: 1:2 ratio;
- risks 100 euros to look for 50 euros: 2:1 ratio from the point of view of risk.The higher the average return versus risk, the less you need a high win rate to be sustainable. The lower the average return compared to the risk, the more you have to have a very high win rate in order not to lose.
This doesn't mean you have to always look for huge targets. It means you need to know what you're doing.
A strategy with small targets can only work if:
- the win rate is really very high;
- leleaks are strictly controlled;
- operating costs do not eat the margin;
- the trader does not move the stop;
- batch management is stable.
A strategy with a lower win rate can work if:
- losses are small and controlled;
- the winning trades are wider;
- the trader leaves room for the best setups;
- the method is respected even after a negative series.
The correct question is not: “How much is alt's my win rate?”
The correct question is, “Does my win rate, along with my risk/return, produce sustainable performance?”
How to read the win rate in a trading journal
The win rate becomes much more useful when it is read in a trading journal.
In the journal you don't just have to mark whether a trade has been positive or negative. You must also record the conditions under which that result ishas been obtained.
For each transaction you should note at least:
- setup used;
- reason for entry;
- confirmations present;
- expected risk;
- initial stop loss;
- expected target;
- final result;
- emotional management;
- any errors made;
- respect or violation of the plan.
This way you can separate the overall win rate from much more useful data.
For example:• win rate of the trades taken second floor;
• win rates of impulsive trades;
• win rate per single strategy;
• win rate per time slot;
• win rate after a loss;
• win rate after a win;
• win rate with correct risk;
• win rate with increased risk.
This reading completely changes the value of the metric.
You may find that your overall win rate is 55%, but trades taken on the second floor have a win rate of62% and a better risk/reward ratio. At the same time, impulsive trades have a 40% win rate and a higher average loss.
At that point you don't have to change the whole strategy. You need to reduce off-plan trades.
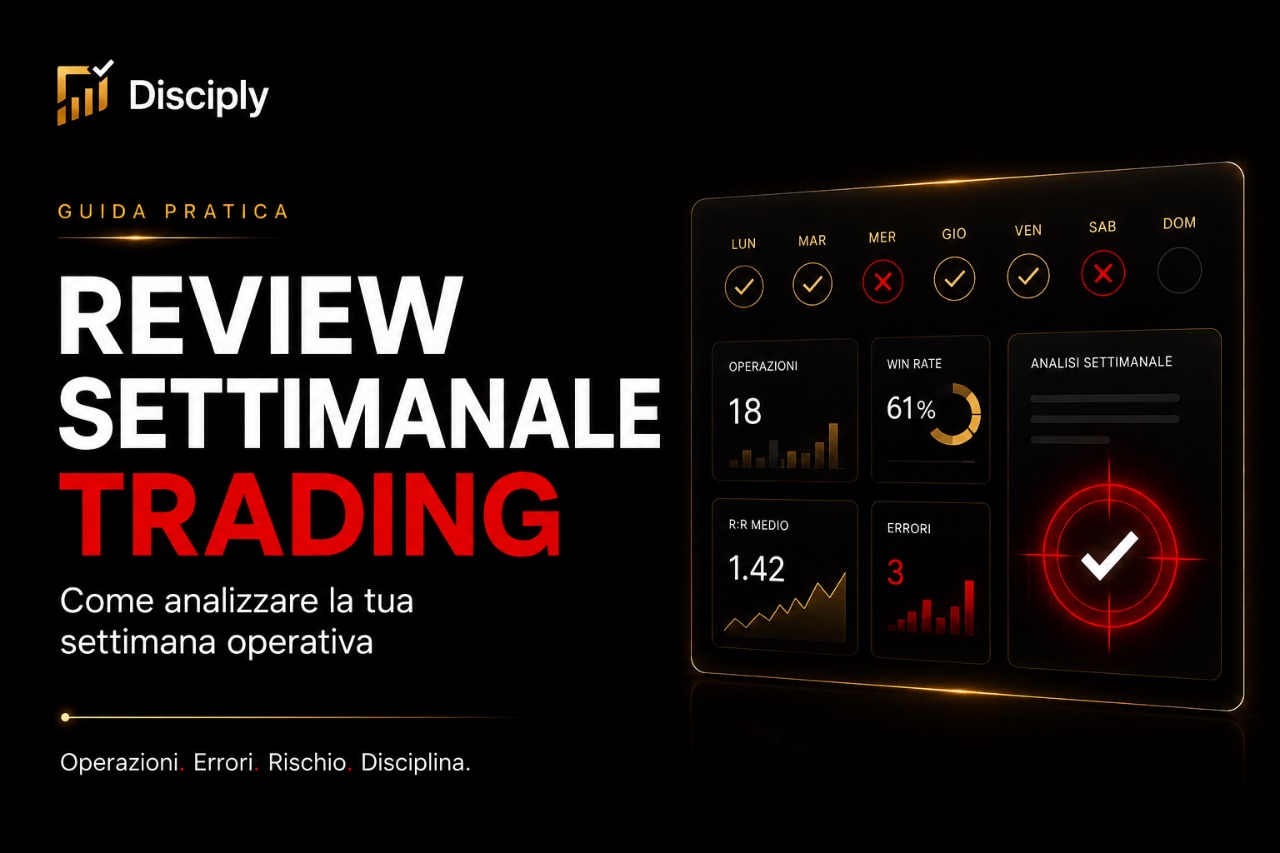
The diary serves precisely to transform raw data into operational information. It doesn't just tell you “how much you win.” It shows you where you are winning well, where you are winning badly, and where you are losing due to lack of process.A weekly trading review can also help you read the win rate the right way, because it forces you to link outcome, risk, behavior, and quality of decisions.
How a trading journal can help
A trading journal helps because it makes visible what the trader's memory tends to distort.
After a busy day, it's easy to remember only the last operation, themore annoying loss or the trade that "could have gone better". This creates a confused perception of one's own operation.
The journal, on the other hand, puts things in
It allows you to see if your win rate changes when you comply with the rules, when you trade at certain times, when you increase your risk or when you enter without sufficient confirmation.
The point is not to fill out a journal to have an archive. The point is to use the diary to make decisionsbetter ones.A good journal can help you understand:
- whether the win rate depends on a real strategy or on chance;
- if large losses always come from the same errors;
- if you are closing winning trades too early;
- if you move the stop after entering;
- if you increase the risk after a positive series;
- whether your average return is consistent with your plan.
The win rate alone tells you how many times you've won. The journal tells you chow you won, how you lost, and what you need to fix.
This difference is fundamental.
A trader who only looks at the win rate looks for confirmation. A trader who uses the journal looks for information.
/Where does Disciply/ come into play?
Disciply comes into play when the trader wants to stop evaluating trades only from the final result.
Registering a trade should not only serve to mark profit or loss. It should ifunderstand if the operation was consistent with the plan, if the risk was correct, if the management was lucid and if the behavior is repeating itself over time.
With Disciply you can connect the win rate to other more important elements:
- risk assumed;
- percentage result;
- input quality;
- operational confirmations;
- behavior during the trade;
- repeated errors;
- performance analysis;
- disciplinesina in the execution.
This allows you to read the win rate more intelligently.
If a strategy has a good win rate but the account does not grow, the problem can be in the risk/return ratio, in the lot, in the management of the stop or in the early closure of profits.
If, on the other hand, the win rate is low but some setups produce very positive operations, the diary can help you understand which conditions deserve more attention andwhich trades need to be eliminated.Disciply doesn't make trading easy. It serves to give structure to the data, so the trader can better see what he is doing and correct the trading process more lucidly.
FAQ
What is a good win rate in trading?
There is no such thing as an absolute good win rate. It depends on the risk/reward ratio, the strategy, the costs and therisk management. 45% can be sustainable if the winning trades are much larger than the losing trades. 70% can be negative if the average losses are too large.
Does high win rate mean a strategy works?
No. A high win rate only indicates that many trades close in profit. It doesn't say how much you earn when you win or how much you lose when you make a mistake. To evaluate a strategy you must also read average loss, profitto average, drawdown, profit factor and quality of execution.
Why can I lose money with a win rate of 70%?
Because losses can be bigger than profits. If you win often but earn little, and when you lose you suffer large losses, the final balance can be negative. The problem is not the number of wins, but the imbalance between average wins and average losses.
How many trades do you need to evaluate the win rate?
Plus the sampleis large, the more useful the data is. Few trades can give initial indications, but they are not enough to judge a strategy. It is better to observe the win rate over larger series and divide it by setup, market conditions, risk and quality of execution.
Is it better to have a high win rate or a high risk/return ratio?Better to have a consistent balance between the two. A high win rate with poor risk/return can be fragile. A lower win rate with large winning trades can be sustainable. The metric should always be read in the context of the strategy.
How can I improve my win rate?
You don't just have to try to win more trades. You must first eliminate impulsive operations, off-plane inputs, random risks, and weak setup. Often the mile win rateit happens when the trader stops taking unnecessary trades, not when he is constantly looking for new strategies.
Conclusion
Win rate in trading is a useful metric, but it becomes dangerous when read on its own.
Knowing how many trades you win is not enough to know if you are working well. You need to know how much you make when you're right, how much you lose when you're wrong, and whether your behavior is consistent with the plan.
A traderhigh win rate can be fragile if you cut profits early and let losses run. A trader with lower win rates can be stronger if they control risk and make room for better trades.
It's not just the payout percentage that makes the difference. The process does it.
For this reason, the win rate must be linked to risk, performance, journaling, operational discipline and performance analysis. Only then does it become a metricuseful to really improve.
/ Key Points /• Win rate measures the percentage of winning trades, not the full quality of the strategy.
• A high win rate does not guarantee profit if the average losses are too large.
• The risk/reward ratio is essential to correctly interpret the win rate.
• The trading journal helps to understand when the win rate comes from method and when from chance.
• Performance must be read by linking result, risk, behaviouror execution.
final report
If you want to use the win rate more seriously, don't just count how many trades you win. It records risk, reason for entry, trade management, and repeated errors.
Disciply helps you turn every trade into actionable data, so you can better read your business process and improve with more awareness.
Related articles
Share article
Disciply
Want to take trading seriously?
Reduce improvisation and impulsive mistakes with checklists, entry reasons, and trade reviews.
Turn every trade into a clear, consistent, measurable process.
Process before outcome.
Start with Disciply
Comments
Latest comments
All comments